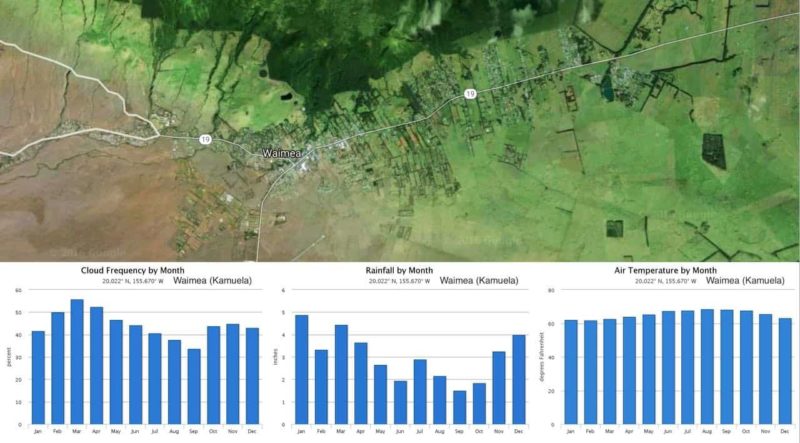
Waimea is built on the northern side of the Big Island. It lies on the slopes of the Kohala volcano in the saddle between this volcano and the famous MaunaKea (more information on Waimea). It lies on the boundary between the lush and rainy Hamakua coast and the dry and sunny north Kona resort coast. Because of these reasons the Waimea weather is difficult to predict.
Table of contents
- Waimea weather on a month-by-month basis (January to December)
- A typical day in Waimea: average daily weather
- Waimea weather summary in a table: temperature, rainfall, and cloud cover throughout the year
Table of Contents
- Waimea weather on a month-by-month basis (January to December)
- A typical day in Waimea: average daily weather
- Waimea weather summary in a table: temperature, rainfall, and cloud cover throughout the year
Waimea is located 2676 feet (815 m) above sea level and this also influences the weather. Temperatures here are generally cooler compared to the rest of the island, and especially the many clear nights can feel crisp.
You can see this in more detail below, where we present you the yearly averages at Waimea for the temperature, the precipitation and the number of cloudy days.
If you are interested in the general weather trends for Hawaii you should read “Big Island weather, explained!“.
Monthly average Waimea weather: temperature, rainfall and cloud cover
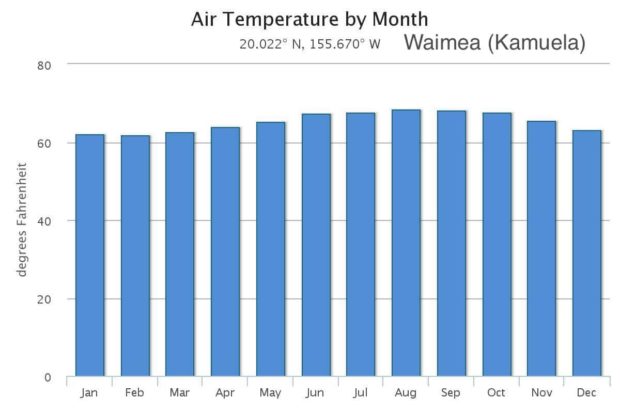
Average temperatures in Waimea range between 61 and 68°F (16 and 20°c). These temperatures are lower than those at most other destinations on the Big Island, which can easily be explained by its altitude: Waimea was built almost 2700 feet above sea level.
July, August, and September are the warmest months, while February is the coolest.
- Monthly air temperature in Waimea on the Big Island of Hawaii
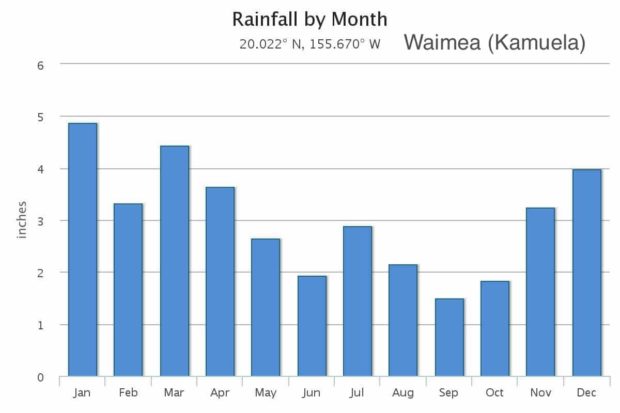
- Rainfall per month for Waimea on the Big Island of Hawaii
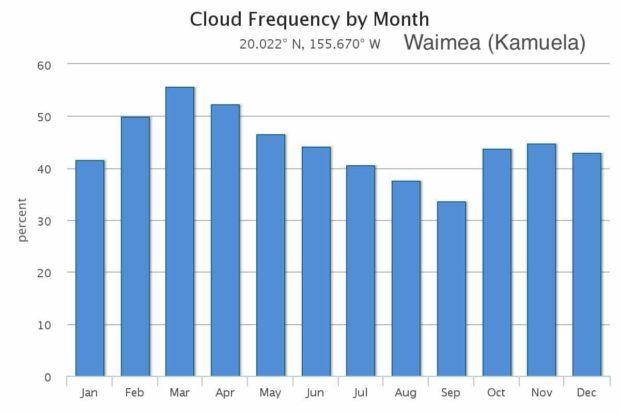
- Cloud frequency per month for Waimea on the Big Island of Hawaii
The amount of rainfall in Waimea is most comparable to, but a bit higher than, the rain in downtown Kona. Waimea receives between 1.5 and 5 inches of rain per month, and a yearly total of 37 inches.
The average monthly cloud cover in Waimea is quite low. This is mostly due to the exceptionally clear nights. During daytime, clouds are unfortunately a common sight.
Daily average Waimea weather: air temperature and cloud cover on a hour-by-hour basis
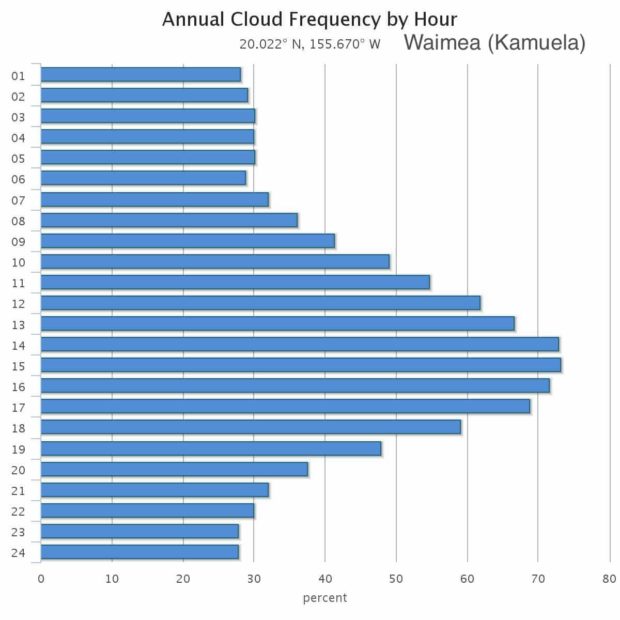
There are large differences in cloud cover throughout the day. You will have the most chance to see the sun around sunrise and sunset while during the day the chance of clouds increases rapidly, peaking above 70% between 2 pm and 4 pm.
The average cloud cover in Waimea is quite low: almost as low as that on the north Kona resort coast. However, this is mostly because of the exceptionally clear nights.
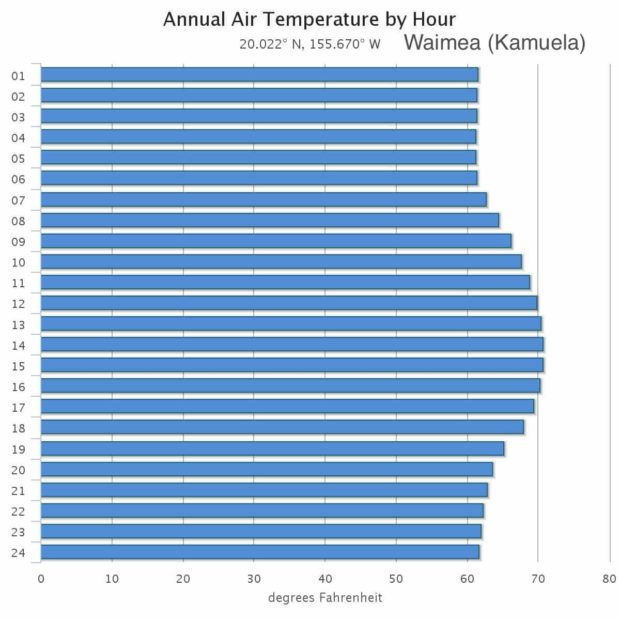
- Hourly air temperature in Waimea on the Big Island of Hawaii
- Hourly cloud frequency for Waimea on the Big Island of Hawaii
The yearly average temperatures vary between the low 60’s during nighttime and the low 70’s in the afternoon. A light coat or a sweater is thus a good thing to bring during the early morning and early evening.
Waimea weather forecast
All the information on this website deals with average temperatures, and it is very likely that the day-to-day weather deviates from these numbers.
If you are interested in the current weather conditions and weather forecast for Waimea, please look up the NAOO forecast.
Weather summary for Waimea
we summarize all the information above in the following table in which you can find the monthly averages for the air temperature, the amount of rainfall, and the percentage of cloud cover.
On average, Waimea is cooler, drier, and has fewer clouds than most popular destinations on the Big Island. Especially the nights here are often clear making this a very good place to go stargazing!
| month | Temperature (°F) | Rainfall (in) | Cloud Frequency (%) |
|---|---|---|---|
| January | 61.91 | 4.922 | 42.07 |
| February | 61.66 | 3.326 | 50.49 |
| March | 62.39 | 4.164 | 56.34 |
| April | 63.64 | 3.726 | 52.93 |
| May | 65.01 | 2.787 | 47.03 |
| June | 67.09 | 2.002 | 44.99 |
| July | 67.49 | 3.137 | 41.49 |
| August | 68.21 | 2.180 | 38.63 |
| September | 67.89 | 1.450 | 34.29 |
| October | 67.56 | 1.922 | 43.97 |
| November | 65.32 | 3.422 | 45.16 |
| December | 63.03 | 3.770 | 43.62 |
| Annual | 65.10 | 36.807 | 45.08 |
Sources
All tables and figures on this page have been created using data from the following source:
Giambelluca, T.W., X. Shuai, M.L. Barnes, R.J. Alliss, R.J. Longman, T. Miura, Q. Chen, A.G. Frazier, R.G. Mudd, L. Cuo, and A.D. Businger. 2014. Evapotranspiration of Hawai‘i. Final report submitted to the U.S. Army Corps of Engineers—Honolulu District, and the Commission on Water Resource Management, State of Hawai‘i.
The data have been downloaded from the Climate of Hawai’i website, which provides a set of maps of the spatial patterns of climate for the major Hawaiian Islands.
